Features
Apache EChartsTM is an open-source JavaScript visualization library, optimized for both PC and mobile devices. Compatible with most modern web browsers, including IE9/10/11, Chrome, Firefox and Safari, ECharts uses ZRender, a graphic rendering engine, to create intuitive, interactive, and highly-customizable charts.
Abundant Chart Types
ECharts supports line series, bar series, scatter series, pie charts, candle-stick series, boxplot series for statistics, map series, heatmap series, lines series for directional information, graph series for relationships, treemap series, sunburst series, parallel series for multi-dimensional data, funnel series and gauge series. It's easy to create combinations of these visualization types with ECharts.
Besides the built-in chart types, ECharts also provides a custom series for users to create more specific chart types. To use it, just pass the renderItem callback function and return any graphic elements you wish to draw, according to the data. ECharts supports native interactivity and so there is no need for further configuration.
ECharts is highly optimised, but if the default package size is too large for you, you can select the chart types and components you need and download them via the online builder.
Multiple Data Format Ready-To-Use
The built-in dataset attribute from ECharts v4.0 supports different data formats, including two-dimensional tables, key-value objects, and more. Data mapping structures can easily be modified with the encode attribute. This makes developing charts much more intuitive, saving time normally spent writing data conversion algorithms. It also saves memory as different components can rely on one dataset rather than multiple copies.
ECharts supports TypedArray, which uses less memory than a standard array and works better with garbage collection. For larger data visualization, TypedArray significantly improves performance.
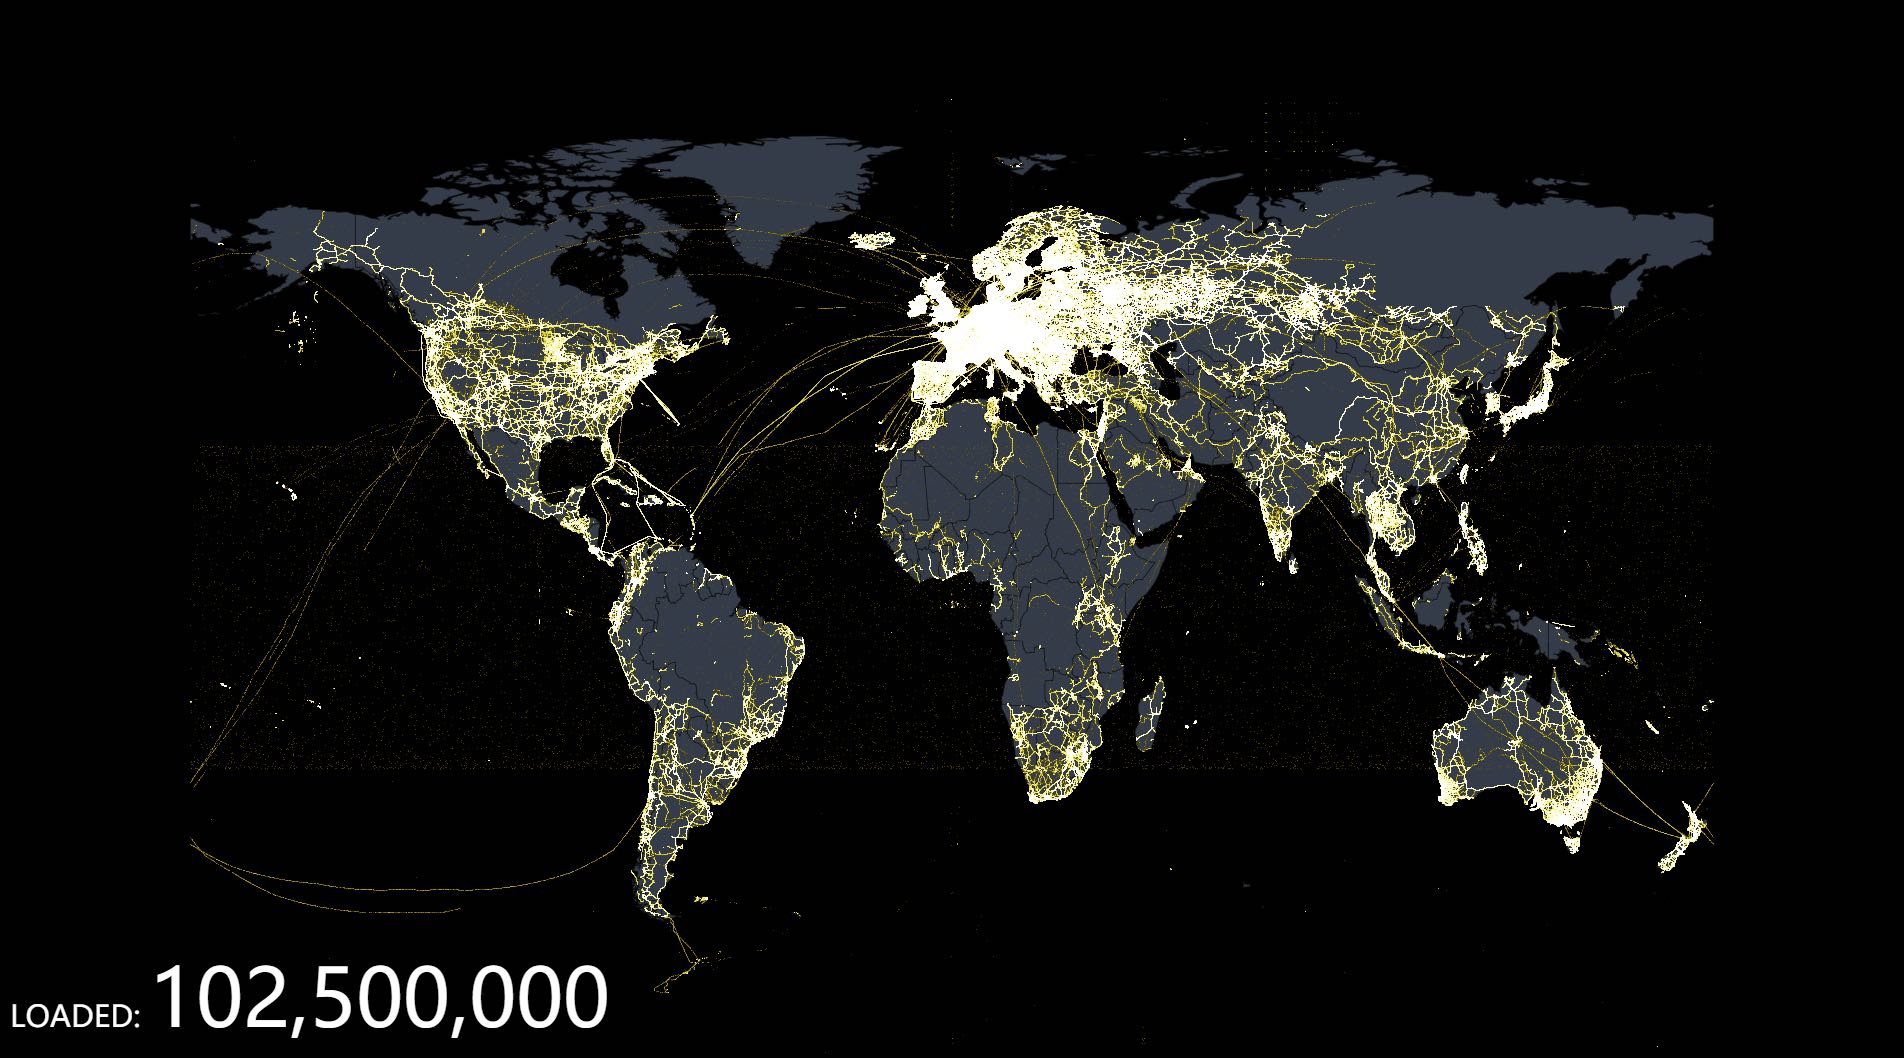
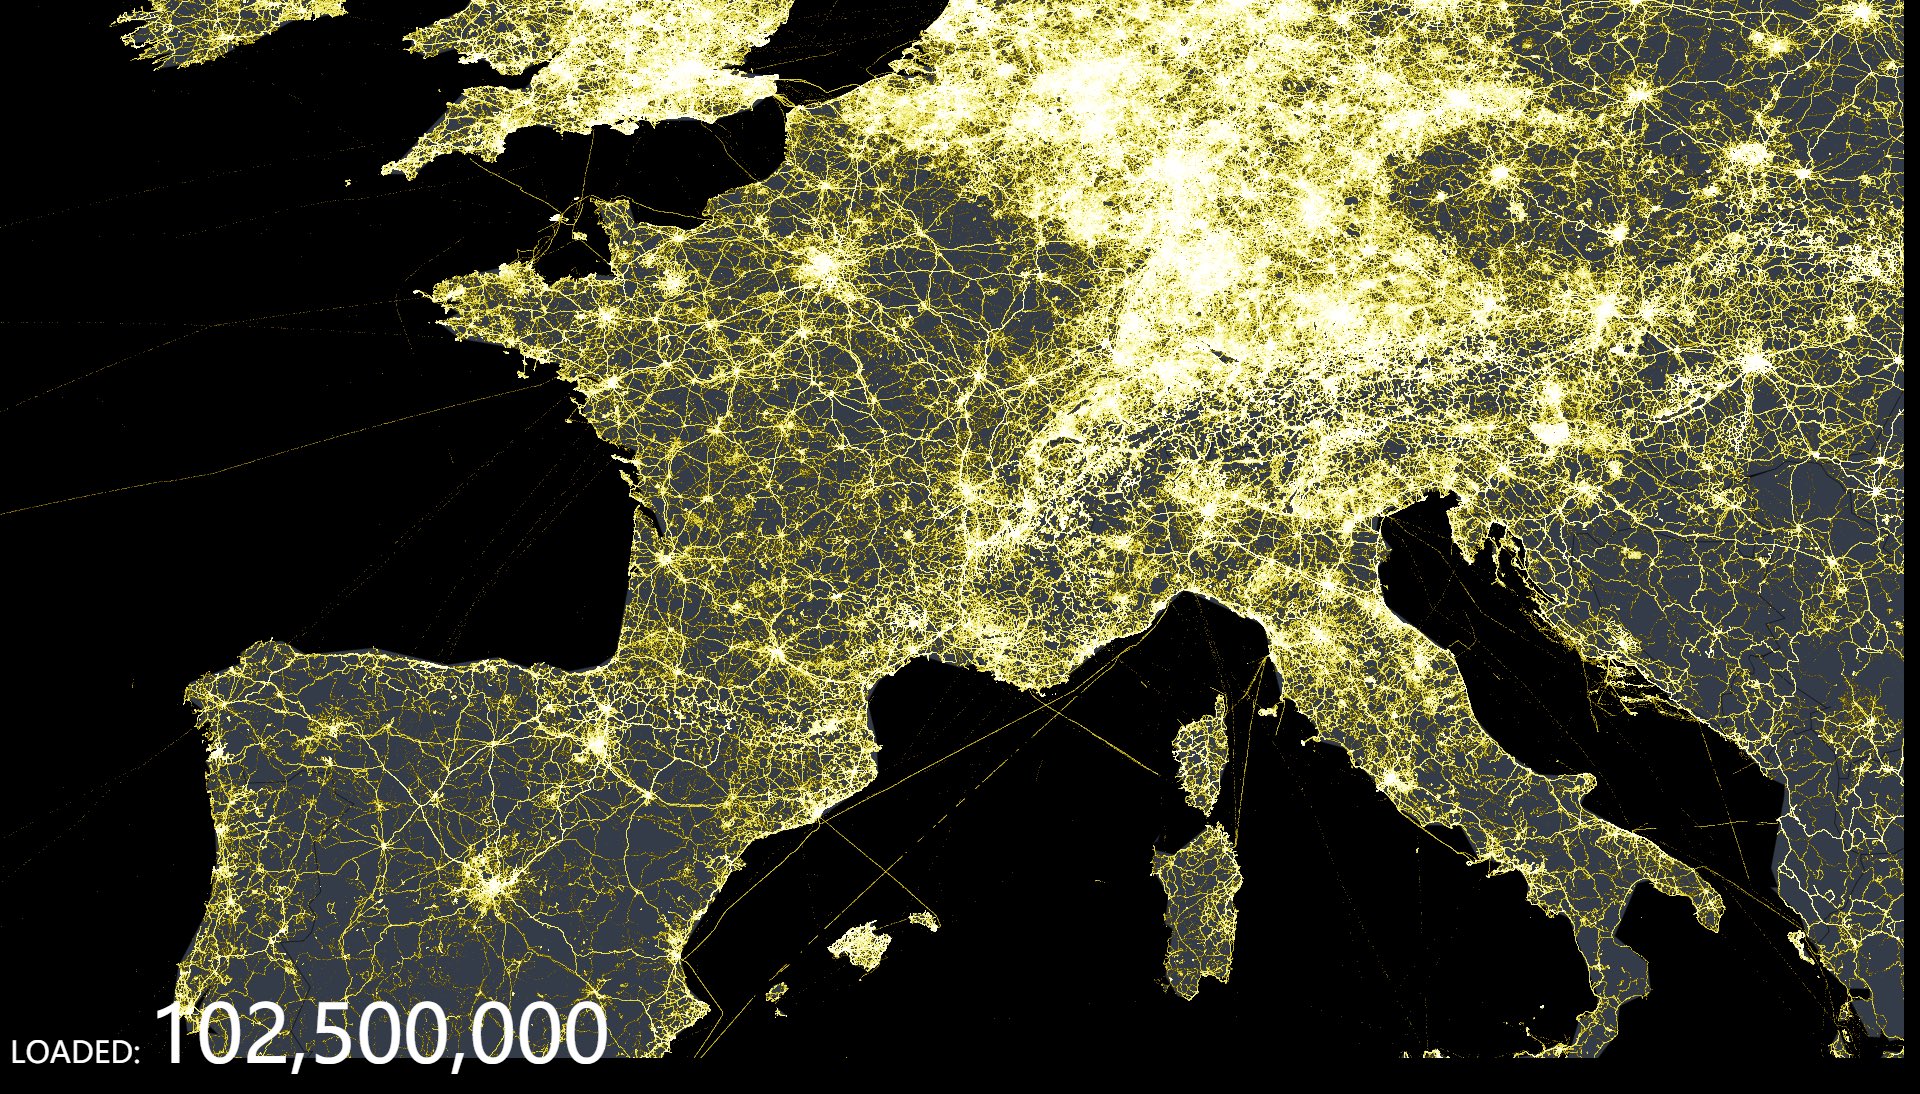
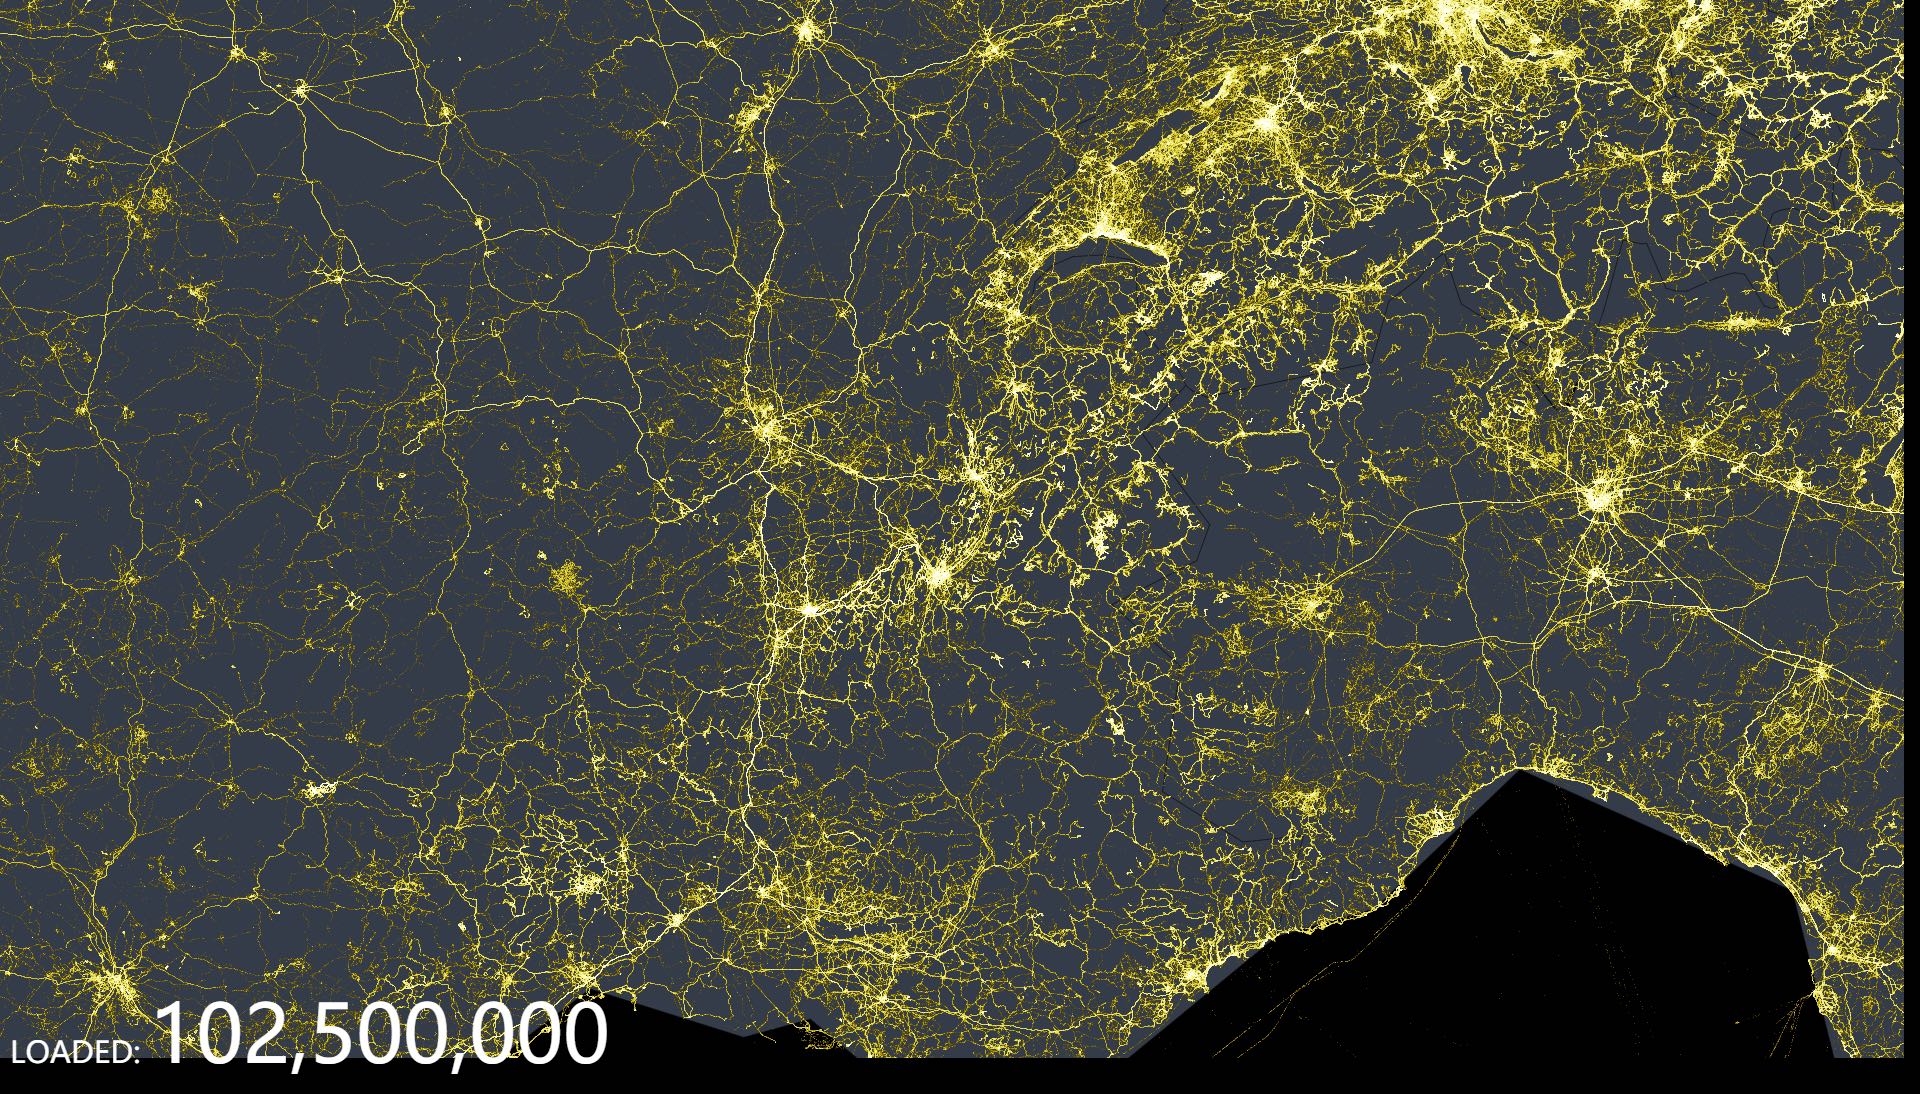
Large-Scale Data Visualizations
EChart v4.0's incremental rendering technique and other optimizations allows it to visualize millions of data points. Interactions like scaling and panning continue to work well even with these large-scale visualizations.
Using this many data points is usually very memory intensive. ECharts supports streaming data since v4.0, allowing you to render as much data as possible using WebSocket. Data can be rendered even when the complete dataset has not yet loaded.
Mobile Optimization
ECharts has been carefully optimized for mobile interaction, such as zooming and panning on small screens. PC users can still use the mouse wheel to perform the same interactions.
The packaging utility allows ECharts to have a small package size on mobile, with the optional SVG rendering engine further reducing memory usage.
Multiple Rendering Methods and Cross-Platform Support
ECharts supports rendering with Canvas, SVG (v4.0+), and VML elements. VML is compatible with older versions of IE; SVG reduces the memory cost on mobiles; and Canvas can easily handle large data visualization and special rendering effects.
In addition to PC and mobile browsers, ECharts can also be used with node-canvas on Node for efficient server-side rendering (SSR). It also supports WeChat MiniProgram since v4.0.
Community contributors also develop extensions for various programming languages, such as pyecharts for Python, echarty for R and ECharts.jl for Julia.
With our wide platform and programming language support, ECharts lets developers focus on the visualisation, rather than the technical details.
Interactive Data Exploration
Interaction is key to understanding data. On initial view, ECharts provides an overview that can be zoomed, panned and filtered to provide more granular information.
Optional elements can be enabled to further interactivity. The legend, visualMap, dataZoom, tooltip, brush and other ready-to-use components allow users to interact with data in multiple dimensions.
Multi-Dimensional Data Support
ECharts 3 strengthened support for multi-dimensional data. In addition to common multi-dimensional data visualization elements, such as parallel coordinates for traditional scatter plots, the input data can also be rendered in multiple dimensions. With the intuitive functions provided by the visual mapping component visualMap, different dimensions can be mapped to color, size, transparency, shading and more.
Dynamic Data
Changes in the underlying dataset will be reflected in real time on charts. Implementing dynamic data is simple, just import the data as normal and ECharts will automatically find the difference between the two sets of data and then use the appropriate animation to represent the data changes. The timeline component can present data in other time dimensions as well.
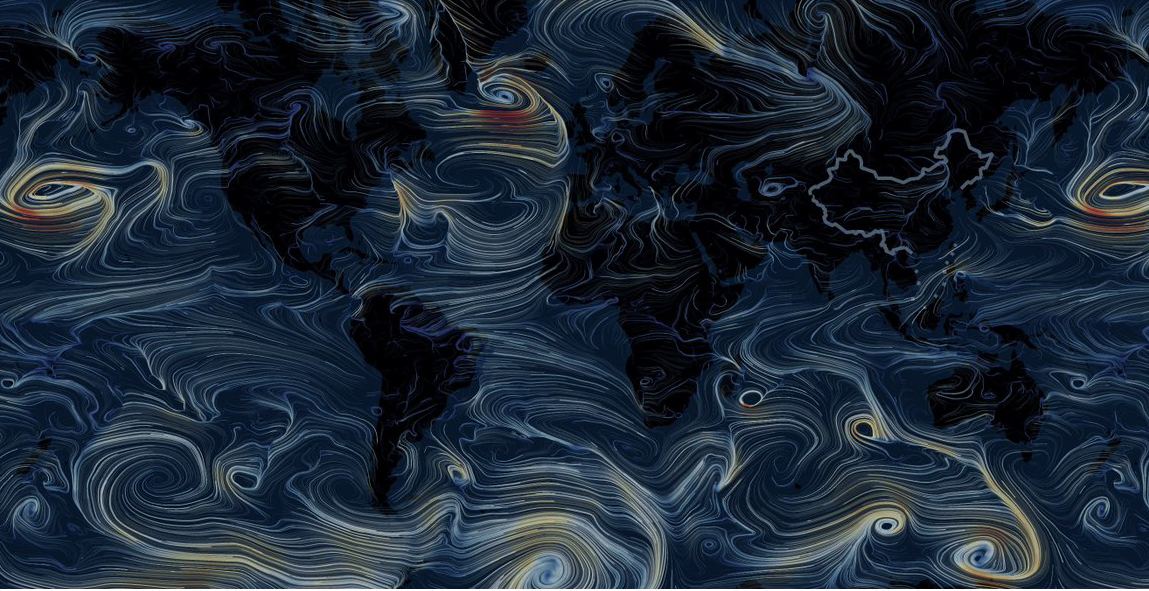
Special Effects
ECharts provides eye-catching effects for the visualization of all data types, whether point, line or geographic.
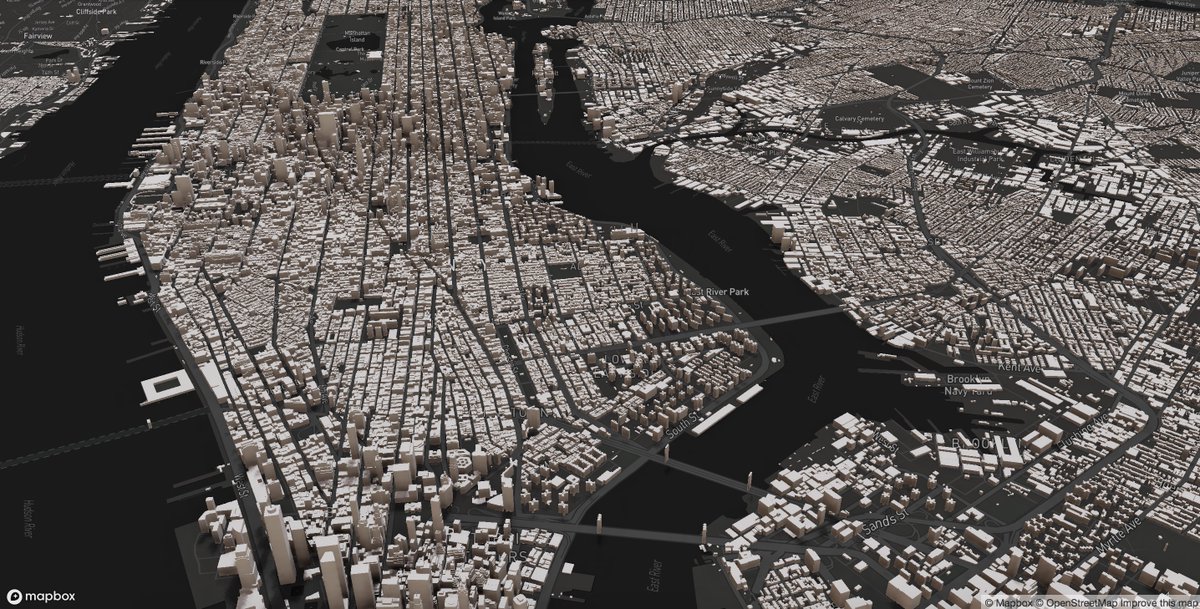
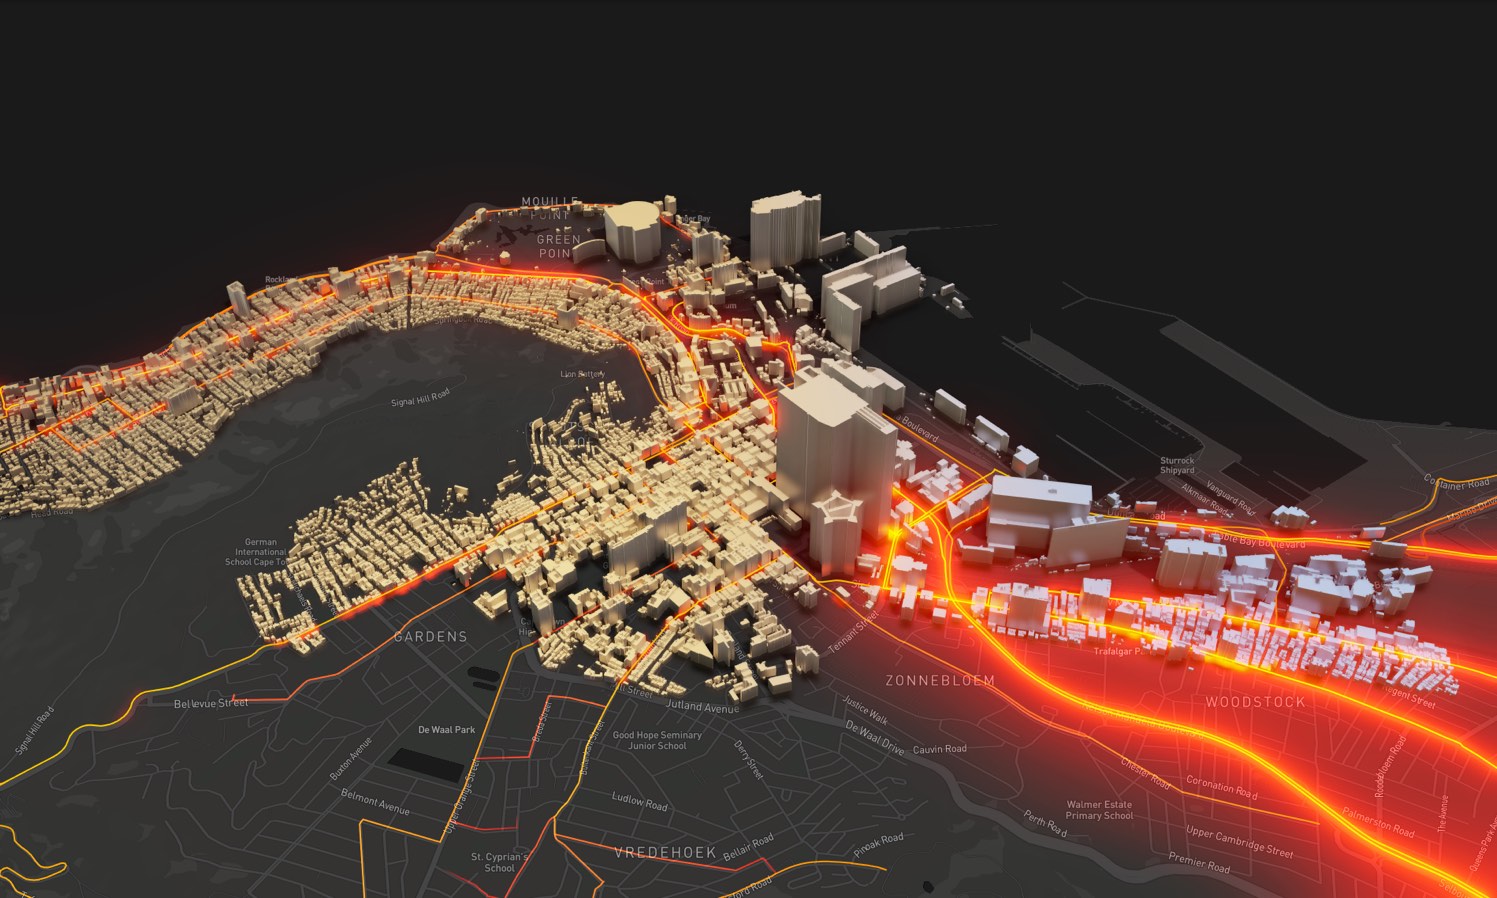
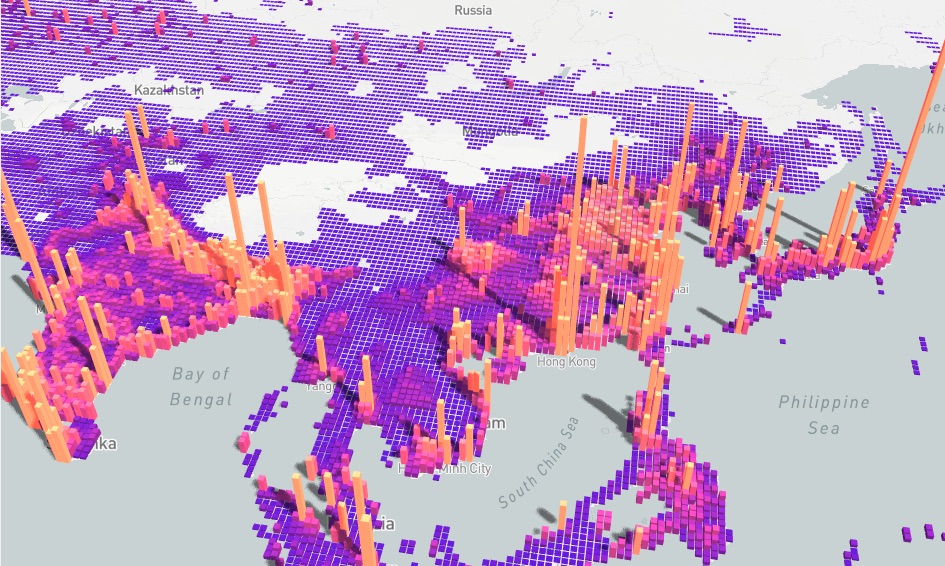
More Powerful 3D Visualizations with GL
ECharts even allows you to perform 3D visualizations in VR and other large screen scenes. The WebGL-based ECharts GL lets you render a 3D Earth, buildings, and population distribution histograms as easily as other ECharts components. To add, simple configuration items let you add effects with just a few lines of configuration changes.
Accessibility
When thinking about a visualization, we naturally associate it with what you see, but there are other dimensions to viewing. The W3C has developed the Accessible Rich Internet Applications Suite (WAI-ARIA), which aims to make web content and web applications accessible to more people with disabilities.
ECharts 4.0 complies with this specification and supports automatic generation of descriptions based on chart configuration items, enabling people with visual disabilities to understand the chart content with screenreaders, so that charts are accessible to all.