
ECharts GL
ECharts-GL provides 3D plots, globe visualization and WebGL acceleration.
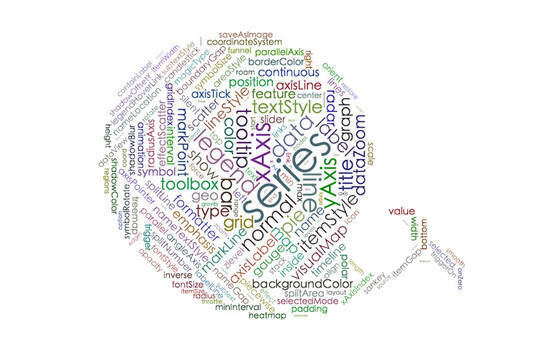
Wordcloud
Cloud charts can layout text into different sizes and colors. You can also use images as masks.
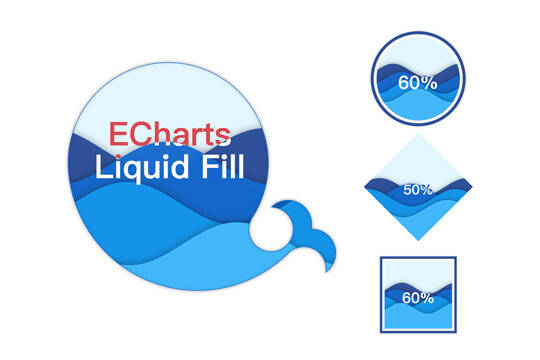
Liquidfill
The liquid-fill chart is a chart suitable for presenting a single percentage of data, supporting multiple water waves and animations.
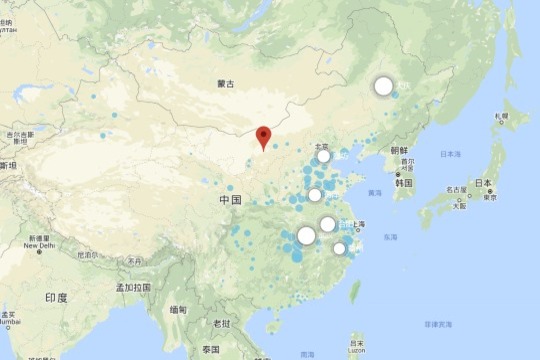
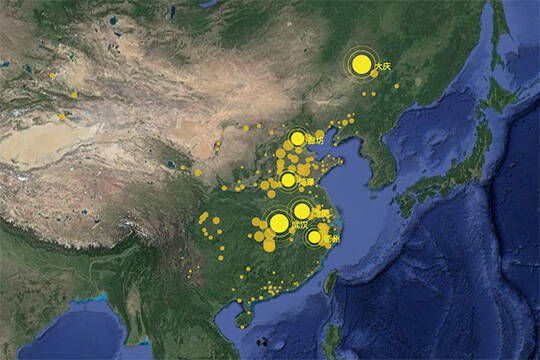
Google Maps
Google Maps extension for ECharts which is used to display visualizations such as Scatter, Lines, Heatmap and Pie.
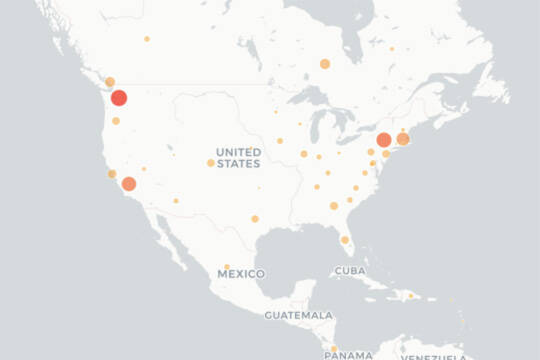
Leaflet Maps
ECharts extension for visualizing data on leaftlet.
Mapbox Maps
A combination of Mapbox maps and ECharts.
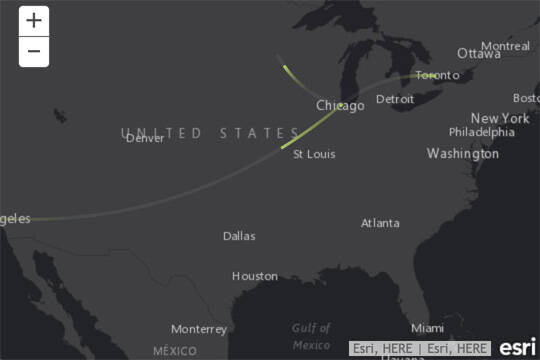
ArcGIS Maps
A combination of ArcGIS maps and ECharts 3.
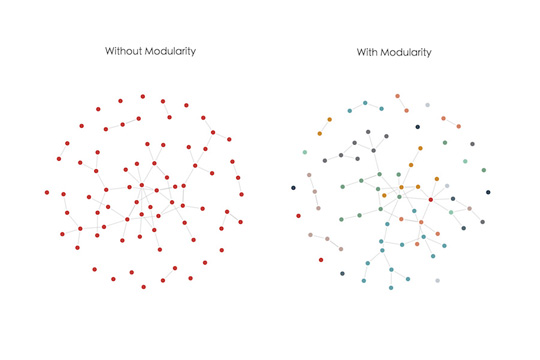
Graph Modularity
The plugin can perform community detection on the ECharts Graph and divide the vertices in the graph into subsets.
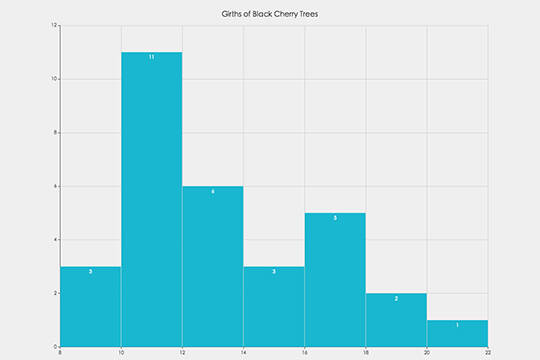
Statistics Tool
The statistical extension is a tool for data analysis.

angular-echarts
AngularJs bindings for ECharts.
echarts-ng
Encapsulate ECharts as an instruction using Angular.
ng-echarts
AngularJs version for ECharts 3.
vue-echarts
Vue.js component for Apache ECharts.
vue-echarts
A custom directive for using ECharts in Vue.js apps.
echarts-middleware
Use ECharts elegantly and efficiently with Vue.
echarts-for-react
Apache ECharts components for React wrapper.
react-echarts
ECharts + React.
re-echarts
ECharts + React.
pyecharts
Python ECharts Plotting Library.
echarts-python
Generate ECharts options with Python.
krisk
Krisk brings ECharts to Python, and helpful tools for statistical interactive visualization.
Rails Charts
Rails Charts provides a Ruby gem enabling use of ECharts in Ruby on Rails applications.

echarty
A thin R/Shiny interface covers full functionality of ECharts.
recharts
recharts provides the R language interface of ECharts.
recharts
An R Interface to ECharts.
ECharts2Shiny
To insert interactive charts from ECharts into R Shiny applications.
ECharts.jl
Julia package for the ECharts 3 visualization library.
purescript-echarts
Purescript bindings for ECharts library.
iOS-Echarts
This is a highly custom chart control for iOS and Mac apps, which builds with ECharts 2.
ECharts-Java
This is a Java version of the ECharts 2 that implements the Java objects corresponding to the JSON structure in all ECharts.
EChartsSDK
ECharts .NET class library, ported from ECharts Java class library.
Echarts-PHP
A PHP library that works as a wrapper for ECharts.
flutter_echarts
A Flutter widget to use ECharts in a reactive way.
