
ECharts GL
3D 图表、地理可视化、WebGL 加速渲染
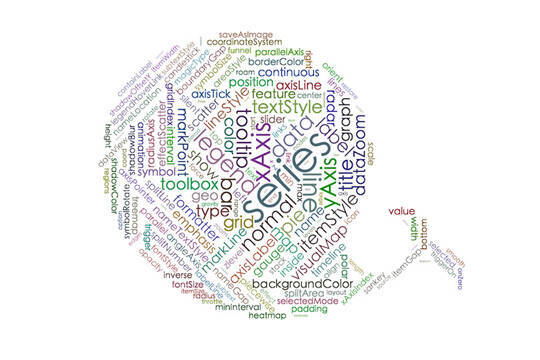
字符云
字符云可以将文字根据不同的权重布局为大小、颜色各异的图,支持使用图片作为遮罩。
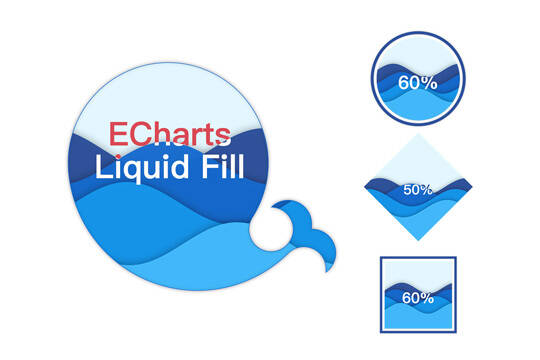
水球图
水球图是一种适合于展现单个百分比数据的图表,支持多条水波和动画。

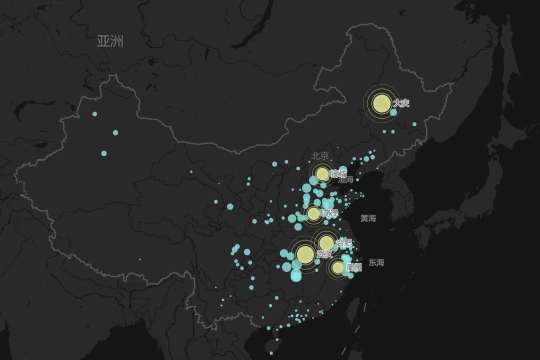
百度地图
百度地图扩展,可以在百度地图上展现点图、线图、热力图及饼图等。
高德地图
高德地图扩展,可以在高德地图上展现点图、线图、热力图及饼图等。

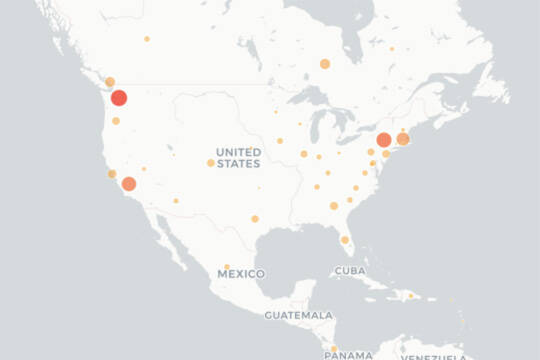
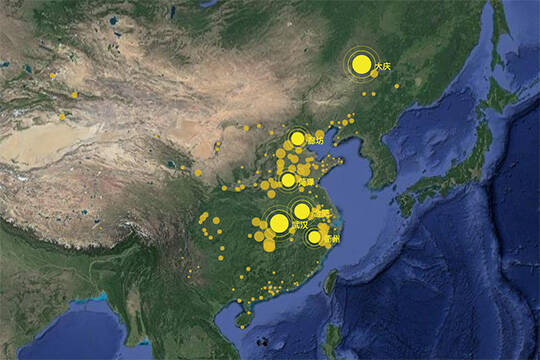
谷歌地图
谷歌地图扩展,可以在谷歌地图上展现点图、线图、热力图及饼图等。
Leaflet 地图
ECharts extension for visualizing data on leaftlet.
Mapbox 地图
Mapbox 地图和 ECharts 的结合。

ArcGIS 地图
ArcGIS 地图和 ECharts 3 的结合。

angular-echarts
AngularJs bindings for ECharts.
echarts-ng
使用 Angular 封装 ECharts 为指令。
ng-echarts
AngularJs 版 ECharts,支持 ECharts 3。
vue-echarts
Apache ECharts 的 Vue.js 组件。
vue-echarts
A custom directive for using ECharts in Vue.js apps.
echarts-middleware
在 Vue 中优雅高效地使用 ECharts。
echarts-for-react
一个简单的 Apache ECharts 的 React 封装。
react-echarts
ECharts + React.
re-echarts
ECharts + React.
pyecharts
Python ECharts Plotting Library.
echarts-python
Generate ECharts options with Python.
krisk
Krisk brings ECharts to Python, and helpful tools for statistical interactive visualization.
Rails Charts
Rails Charts提供了一个Ruby gem,可以在Ruby on Rails应用程序中使用图表。

echarty
echarty 提供了 ECharts 的 R 语言接口。
recharts
recharts 提供了 ECharts 的 R 语言接口。
recharts
An R Interface to ECharts.
ECharts2Shiny
To insert interactive charts from ECharts into R Shiny applications.
ECharts.jl
Julia package for the ECharts 3 visualization library.
purescript-echarts
Purescript bindings for ECharts library.
iOS-Echarts
This is a highly custom chart control for iOS and Mac apps, which builds with ECharts 2.
ECharts-Java
这是一个针对 ECharts 2 的 Java 类库,实现了所有 ECharts 中的 JSON 结构对应的 Java 对象。
EChartsSDK
ECharts 的 .NET 类库,从 ECharts 的 Java 类库移植。
Echarts-PHP
A PHP library that works as a wrapper for ECharts.
flutter_echarts
A Flutter widget to use ECharts in a reactive way.
